Past Meetings

Image Descriptions 2009

Viscous Splash

M.M. Driscoll
S.R. Nagel
University of Chicago

13-driscoll-thumb.jpgA drop of moderately viscous silicone oil (with viscosity 10 times that of water) hits a dry glass surface.

At atmospheric pressure, the drop first spreads smoothly, then after about a millisecond, a thin sheet of fluid is ejected. This sheet of fluid is approximately ten times thinner than the initial spreading edge. After the sheet is ejected, small air bubbles begin to be entrained into the trailing edge. As the drop continues to spread, larger and larger bubbles are entrained, reaching a final diameter of about 30 micrometers. Suddenly, air entrainment ceases as the spreading liquid slows below a critical velocity of ~ 1.2 m/s. The drop continues to expand until the thin sheet begins to rip apart, creating a splash.

As with less viscous fluids [1], when the ambient air pressure is lowered (to ~ 20% atmospheric pressure) splashing is completely suppressed. No thin sheet is created and no air is entrained into the expanding liquid. In this case, the spreading edge remains smooth and even.

This work is supported by the National Science Foundation.

References
[1] L. Xu, W. W. Zhang, and S. R. Nagel, Phys. Rev. Lett.
94, 184505 1-4 (2005).

Reporters and Editors
Reporters can freely use this image. Credit: M.M. Driscoll and S.R. Nagel, University of Chicago.

Stretching and Deformation of a Viscous Filament in a Turbulent Flow 

Monica Martinez and R. Zenit
Instituto de Investigaciones en Materiales,
Universidad Nacional Autonoma de Mexico

17-zenitB-thumb.jpgWe are studying the process of deformation and breakup of a viscous thread immersed in a turbulent flow. The motivation for this study arises from the need to understand the mechanisms that controls the formation of emulsions of very viscous liquids, a process that will be used to handle highly viscous oil residues. The visualization was obtained with a high-speed camera at 250 frames/s. These images show a time sequence of a viscous thread being deformed under the action of water turbulent flow. We have observed that the thread is surprisingly stable: it is largely stretched before breakup is observed. The turbulent fluctuations elongate the filament such that its diameter progressively thins in time.

This investigation is funded by the National Autonomous University of Mexico research program (PAPIIT-UNAM).

Reporters and Editors
Reporters can freely use this image. Credit: M. Martinez Thesis (UNAM), 2009.

A Short-Wave Instability Caused by the Approach of a Vortex Pair to a Ground Plane

Daniel M. Harris
Victor A. Miller
Charles H. K. Williamson
Cornell University

The counter-rotating pair of vortices formed from aircraft wingtips in flight presents a potential hazard to other aircraft in the form of a sustained rolling moment. Such a trailing vortex pair travels downwards under its own self-induced velocity. Under conditions where an aircraft is close to the ground, at an airport, the vortices can interact with the ground plane. The inviscid trajectories of the vortices, as originally predicted by Lamb (1932), differ quite significantly from what is observed in experiment. This is primarily due to the fact that between the vortices and the ground, a boundary layer forms, which can separate to generate secondary vortices of opposite sign. The secondary vortices significantly influence the trajectories and development of the original vortex pair, an effect originally discovered by Harvey and Perry (1971).

Figure 1

In the present work (Figure 1), we have developed a novel technique using laser-induced fluorescence to visualize this secondary vorticity in detail, by pooling dye on the ground plane prior to launching the vortex pair from rotating flaps. In fact, it is possible to mark only the secondary vorticity with dye, in order to highlight this structure, while leaving the primary vortices invisible!

In image below (Figure 2), we show the cross section of the primary vortices. We also visualise the secondary vortices, which were originally generated by ground interaction, and are now visible above the primary structures. The lower half of the photo shows a mirror image of the vortex system, due to optical reflection in the ground plane.

Figure 2

Our primary motivation is towards an understanding of the development of new 3D instabilities. The first photograph (Figure 1) captures the essence of our technique, as we are able to visualize the secondary vorticity generated at the wall, as it is induced to rotate around the (invisible) primary structures. Here we are illuminating more clearly the complex periodic deformations due to a short wave 3D instability. A similar short wave instability was predicted in a numerical simulation completed by Luton and Ragab (1997), and from the very recent work of Duponcheel et al. (2009), but to our knowledge, a precise experimental visualization of this phenomena does not currently exist in literature. In this example, we employ a thin horizontal laser light sheet, which highlights the beauty and periodicity of this 3D instability, for vorticity that has rotated almost one revolution around the primary structures.

The research is partially supported by the Office of Naval Research.

References
  • Duponcheel, M., Cottin, C., Daeninck G., Winckelmans, G. and Leweke, T. (2009). Three-dimensional dynamics of vortex pairs in ground effect: experiment and numerical simulations. Submitted to Physics of Fluids.
  • Harvey, J.K. and Perry, F.J. (1971). Flowfield produced by trailing vortices in the vicinity of the ground. AIAA J., 9(8):1659–1660.
  • Lamb, H. (1932). Hydrodynamics. 6th edition, Dover Publications, New York, NY.
  • Luton, J.A. and Ragab, S.A. (1997). Three-dimensional interaction of a vortex pair with a wall. Phys. Fluids, 9(10):2967–2980./

Reporters and Editors
Reporters can freely use these images. Credit: Harris, Miller & Williamson (2009).

Splash: Drop Impact on Small Targets

Cynthia Ericksen
Drazen Drazen Dragutinovic
Paulo E. Arratia
Department of Mechanical Engineering & Applied Mechanics, University of Pennsylvania

rops impacting on surfaces are often seen in nature and in everyday life. For example, nail-like jets and bubbles are familiar spectacles when rain falls on puddles and ponds. Here, the dynamics of drops impacting small targets is investigated in experiments using high-speed imaging up to 30,000 frames per second. We consider a situation in which the typical length scale of the target is of the same order of magnitude as the drop so that the liquid/solid interaction is minimized. The targets are small, long cylindrical posts made of Delrin; they are 5 cm long and 0.8 cm in diameter. Drops are formed using a syringe pump and are allowed to hit the vertical posts under free-fall at a speed of approximately 3 m/s.

A sample snapshot (Figure 1) shows that an impacting water drop quickly spreads and deforms into a two-dimensional liquid lamella. This thin water sheet becomes unstable due to surface tension, and waves of distinct length are observed. In addition, a thick rim is formed at the edges of the liquid lamella, which also becomes unstable. This rim later develops multiple jets, which in turn break up into small droplets in a process similar to the Rayleigh-Plateau instability.

Reporters and Editors
Reporters may freely use this image. Credit: Paulo E. Arratia (University of Pennsylvania).

Visualization of the Flow Around Shells Used by Hermit Crabs

Barbara Casillas
G. Alcaraz
R. Ledesma
R. Zenit
Universidad Nacional Autonoma de Mexico

The flow around gastropod shells used by hermit crabs (Calcinus californiensis) was visualized experimentally. These crabs choose their shells according to many factors; it is believed that the choice of shell (shape and weight) is directly related to the drag caused over them by the exposure to wave action .

zenit09a.jpg

Using a visualization technique called particle image velocimetry (PIV), we can see what the flow around the shells looks like. From these measurements, we are able to quantify the amount of drag exerted on the shells by the flow. We have found that the drag around rough shells is smaller at large velocities; for smaller velocities, the drag around smooth shells is smaller. These observations are in agreement with field observations (Argüelles et al., Sci. Mar., 2009).

This work is funded by the National Autonomous University of Mexico research program (PAPIIT-UNAM).

References
Argüelles et al., Science, March, 2009

Reporters and Editors
Reporters can freely use these images. Credit: Barbara Casillas Thesis (UNAM), 2009.

Lagrangian Feature Extraction of the Cylinder Wake

Jens Kasten - ZIB, Berlin
Christoph Petz - ZIB, Berlin
Ingrid Hotz - ZIB, Berlin
Gilead Tadmor - Northeastern University, USA
Bernd R. Noack - TU, Berlin
Hans-Christian Hege - ZIB, Berlin

5-kasten-thumb.jpgWe extract Lagrangian features in the 2-D von-Kármán vortex street behind a circular cylinder. The distance of neighboring fluid particles is monitored with forward and backward time evolution over two shedding periods.

The height of the grey surface represents the maximum of the logarithm of these distances (FTLE in Kasten et al. VMV 2009). Red coloring indicates regions of particle divergence in forward time. Blue regions show convergence. The intersection of both curves marks Lagrangian saddle points (Haller 2001 Phys. D). The direction of the flow field is indicated by lines on the surface. Thus, the mixing of the von-Kármán vortex street is characterized by the Lagrangian saddle points, their attractive and separating invariant manifold "arms" mark domains of particle attraction and separation.

This project was funded by DFG (Deutsche Forschungsgemeinschaft) and the NSF (National Science Foundation).

References
G. Haller, "Distinguished material surfaces and coherent structures in three-dimensional fluid flows." Physica D (2001) 149, 248-277.

An alternative computation method of the FTLE:
Jens Kasten, Christoph Petz, Ingrid Hotz, Bernd R. Noack, Hans-Christian Hege, "Localized Finite-time Lyapunov Exponent for Unsteady Flow Analysis." Accepted for publication in Proceedings of VMV 2009 (Braunschweig, Germany).

Reporters and Editors
Reporters can freely use this image. Credit: Jens Kasten Christoph Petz Ingrid Hotz Gilead Tadmor, Bernd R. Noack, Hans-Christian Hege

Bubble Cluster Explosion

P.A. Quinto-Su
C.D. Ohl
School of Physical and Mathematical Sciences
Department of Physics and Applied Physics
Nanyang Technological University

6-su-thumb.jpgTwenty-five laser-induced cavitation bubbles are created simultaneously inside a thin liquid gap using a single laser pulse.

On this picture the array of bubbles is imaged with time-lapse photography at 6 microseconds after the arrival of the laser pulse, the width of the frame is 188 micrometers. The bubbles are deformed due to strong interactions with neighboring bubbles. In addition, bubble shielding leads to a delayed collapse of the central bubbles that experience mainly vapor pressure. The outer bubbles collapse due to the static pressure of the surrounding liquid.

On this image it can be seen that the bubbles on the periphery are already collapsing, while the bubbles at the center have almost reached their maximum size. To create the array of bubbles the spatial profile of the laser is shaped into 25 foci using a spatial light modulator. In this way, arbitrary arrays of bubbles can be created by changing the digital hologram projected on the spatial light modulator.

This work was funded by NTU Singapore.

Reporters and Editors
Reporters can freely use this image. Credit: Cavitation lab, SPMS Nanyang Technological University

Antibubbles in a Cyclone Eyewall

D. Terwagne
G. Delon
N. Vandewalle
H. Caps
S. Dorbolo
GRASP, Opto-fluidique Département de Physique B5
Université de Liège B-4000
Liège, Belgium

At least once in one's life, one spends hours blowing bubbles out of a soapy water film entrapped in a frame. On the other hand, very few people spend hours making antibubbles whereas it is very easy to generate. An antibubble is the inverse of a bubble. Who would expect that something spectacular may result when soapy water is poured on a pool of the same soapy water? By adjusting the flow, it is possible to entrain a thin air film that is able to imprison a 10 mm soapy water globule beneath the pool surface. Numerous tricks exist on the web [1]. Their scientific discovery dates as from 1932 [2] but developments can be only found in the last decade [3,4,5]
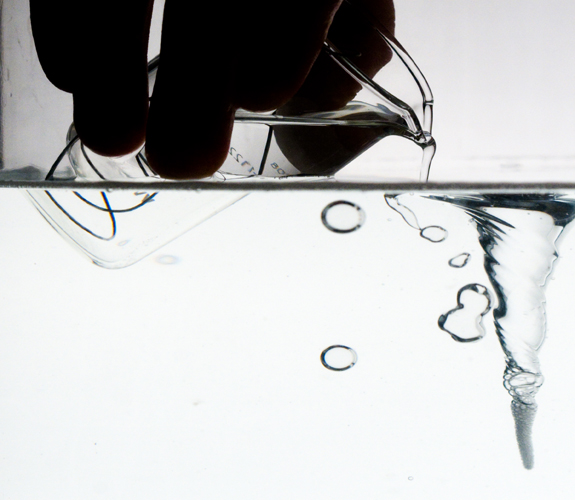
Antibubbles are about to born. Soapy water is poured from a Bécher into a soapy water pool. Air is entrained (dark regions below the pool surface)10 mm

In the present work, antibubbles are precipitated in a whirlpool. A whirl is a singularity in the liquid and attracts the objects that venture to close. This latter effect is due to the morphology of the flow around the vortex. The speed of the flow varies rapidly close to the eye. An object that approaches the eyewall is submitted to large constraint and (if it is deformable) the object is modified by the stress.
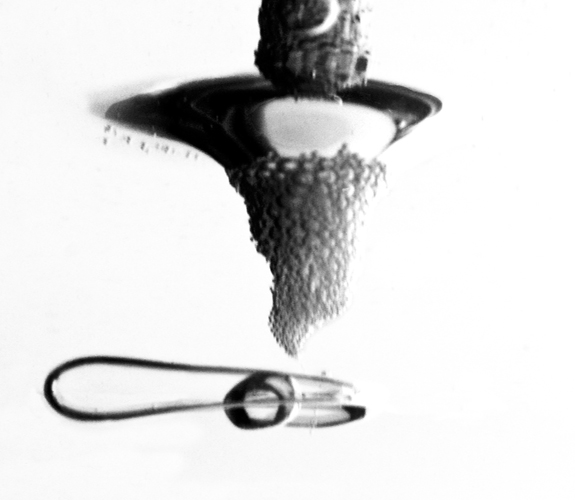
An antibubble has been trapped by the attraction field of the vortex. The antibubble elongates and wound around the whirl eye. The antibubble forms loops and is extremely elongated before popping.

According to the antibubble size, different scenarios have been encountered. For example, the antibubble may be vertically expanded before explosion. Another spectacular example is observed when the antibubble wound around the vortex like a serpentine forming an "anti-spaghetti".

S. Dorbolo is supported by F.R.S.-FNRS. Part of this work has been helped by exchanges through COST P21 "Physics of droplet" network (ESF).

References
[1] see http://www.antibubble.com, http://www.youtube.com/stephanedorbo and also C.L. Stong, Scientific American, 230, 116 (April 1974).
[2] W. Hughes and A.R. Hughes, Nature 129, 59 (1932).
[3] S. Dorbolo, E. Reyssat, N. Vandewalle, and D. Quéré, Europhys. Lett. 69, 966 (2005).
[4] S. Dorbolo, H. Caps, and N. Vandewalle, New J. Phys. 5, 161 (2003).
[5] P. Geon Kim and H. Stone, Europhys. Lett. 83, 54001 (2008).

Reporters and Editors
Reporters can freely use these images. Credit: Jens Kasten, Christoph Petz, Ingrid Hotz, Gilead Tadmor, Bernd R. Noack, Hans-Christian Hege.

The Geometry of Ocean Mixing

Carolina Mendoza
Ana M Mancho
Instituto de Ciencias Matemáticas
CSIC-UAM-UC3M-UCM
Madrid, Spain

8-mancho1.jpg

Mixing processes in oceans are key contributors to very important features of the current climate. A better understanding of these processes and their representation in climate models is required for improved predictions of climate change [1,2]. Lagrangian tools provide a mathematical description of mixing and transport in fluid flows, since they are used to predict where fluid particles go.

Behind this description underlies Poincaré's idea of seeking geometrical structures over the ocean surface (the phase portrait) that have a role in organizing all trajectories into regions corresponding to qualitatively different types of trajectories. On the figure it is displayed the evaluation of a recently defined Lagrangian tool [3,4] on a velocity field measured from altimetric satellites over the Kuroshio current on selected days in May and June 2003.

On the figure, the organizing centers of this highly aperiodic flow are located at a glance. Also are recognizable phase portraits similar to the cat's eyes of the forced pendulum, or to the forced Duffing equation. The ocean surface resembles a patchwork of interconnected dynamical systems where the complexity of possible particle routes is envisaged.

8-mancho2_2.jpg

The computational part of this work was done using the CESGA computer FINIS TERRAE. The authors have been supported by CSIC Grant OCEANTECH No. PIF06-059, Consolider I-MATH C3-0104, MICINN Grants Nos. MTM2008-03754 and MTM2008-03840-E, and the Comunidad de Madrid Project No. SIMUMAT S-0505-ESP-0158.

References
[1] Q. Schiermeier, Churn, Churn, Churn. Nature 447, 522-524 (2007)
[2] A. S. Bowen, M. S. Lozier, S. F. Gary, C. W. Böning, Nature, 459, 243-247 (2009).
[3] J. A. Jiménez Madrid, A. M. Mancho. Chaos 19 (2009), 013111-1-013111-18.
[4] C. Mendoza, A.M. Mancho. The hidden geometry of ocean flows. Manuscript in preparation.

Reporters and Editors
These images have not yet been published, though they are part of a manuscript that is in preparation. Credit: Carolina Mendoza & Ana M Mancho.

Revisiting Karman Vortex Street

Sanjay Kumar
George Laughlin
Department of Engineering
The University of Texas at Brownsville

9-kumar-thumb.jpgIt is well known that flow exhibits unsteady periodic behavior when flowing over bluff bodies such as a circular cylinder. The unsteadiness is observed above a certain critical flow speed in the form of periodic vortex shedding pattern known as Karman Vortex Street. The image shows the Karman Vortex street behind a 6.35 mm diameter circular cylinder in water at Reynolds number of 168. The visualization was done using hydrogen bubble technique. The image was taken to test the flow visualization set-up on more complex problem of the effect of spin on the Karman Vortex Street which has been experimentally investigated by the authors and the work has been submitted to the Physics of Fluids journal.

NSF GRANT # CMMI 0723094 provided equipment support for a Particle-Image-Velocimetry system used in the research related to the work on flow around a spinning cylinder.

References
The image has not been published anywhere but the research related to the image has been submitted to Physics of Fluids.
S.Kumar, C.Cantu, and B.Gonzalez, "An Experimental Study of Flow around a spinning cylinder" Physics of Fluids (submitted).

Reporters and Editors
Reporters can freely use this image. Credit: Sanjay Kumar and George Laughlin; Department of Engineering, The University of Texas at Brownsville.

Vortex Furrows in the Transitioning Boundary Layer

Peter S. Bernard
Department of Mechanical Engineering
University of Maryland

10-bernard-thumb.jpgMushroom shaped vortices composed of vortex filaments erupt outward from the region adjacent to a solid boundary as the flow (toward the viewer) transitions from a smooth, laminar state towards one that is chaotic and turbulent. The vorticity contained within the filaments enters into the flow at the wall surface as a result of frictional forces near the boundary that slows the movement of the fluid. The view in the figure is the end stage of a process that first begins with a streamwise buckling of the nominally well ordered array of filaments due to a fundamental flow instability.

Proceeding downstream, the furrow-like disturbances in the filaments grow in height forming simple arches that further evolve into mushroom-like shapes as they eject toward the outer flow. The furrows collect slow moving fluid into long streaks that travel outward with the mushroom-like vortices, contributing to an important exchange of high and low momentum that is one of the most significant affects of turbulent fluid motion.

This work was supported by NSF through teragrid resources provided at the Pittsburgh Supercomputing Center.

References
A preliminary account of this work appeared as AIAA Paper 2009-3547 at the 19th Computational Fluid Dynamics Conference in San Antonio, Texas, June 1009. A revised and updated version of this paper is currently under review at the AIAA Journal.

Reporters and Editors
The picture is not published. Reporters can freely use this image. Credit: Peter Bernard.

3-D Flow Visualization of a Turbulent Jet

Lynch and Brian Thurow
Auburn University
Department of Aerospace Engineering

11-thurow-thumb.jpgThe transition to turbulence in a jet is captured in three-dimensional detail using a recently developed high-speed 3-D flow visualization technique. In this image, the flow of a Reynolds number 9500 jet is seen to transition through various stages as it develops into a fully developed turbulent flow field. In the near-field of the jet, the flow is initially laminar and responds to the Kelvin-Helmholtz instability as it forms ring vortices. This is followed by the onset of azimuthal instabilities that take the form of long thin fingers of fluid periodically positioned around the periphery of the jet core. The interaction and growth of the azimuthal instabilities with the ring vortices leads to the complex and three-dimensional flow in the far field typically associated with turbulent flows.

The 3-D image presented here has a resolution of 312 x 260 x 100 pixels and was formed by imaging a high-repetition rate laser sheet that was scanned through the smoke seeded flow field using a galvanometric scanning mirror. High-speeds are made possible using a MHz rate pulse burst laser system that is able to produce a burst of 100 high energy, short duration pulses at 1,000,000 pulses per second. Images were captured using a 1,000,000 frames per second high-speed camera with a total exposure time of only 100 microseconds. The 3-D image was then reconstructed from the high-speed sequence of 100 images.

This work was sponsored by the Army Research Office under Grant No. W911NF-06-1-0400

References
Thurow, B., and Lynch, K., “Development of a
High-Speed Three Dimensional Flow Visualization Technique,” accepted
for publication in AIAA Journal, 2009.
Thurow, B., Satija, A. and Lynch, K., “3rd generation MHz rate pulse
burst laser system,” Applied Optics, Vol. 48, pp.2086-2093 2009.

Reporters and Editors
Reporters can freely use this image. Credit: Brian Thurow, Auburn University.

Water in Acoustic Motion

George Lewis Jr.
William Olbricht
Cornell University

12-lewis-thumb.jpgThe action shot of the "ultrasonic fountain" shows the interaction of High Intensity Focused Ultrasound (HIFU) waves with water. The ultrasound transducer is typical of medical physical therapy ultrasound devices; operating at 1.5 MHz and with a diameter of 2.54 cm. The difference in this picture is that the transducer is powered 20x greater than typical, and the energy from the transducer is focused to a 1mm^3 volume creating a HIFU spot near the surface of the water. Since ultrasound is a mechanical wave, the HIFU spot sees large pressure changes as the sound travels via compression and rarefaction in the propagation fluid, which results in cavitation and micro-bubble formation in the water. The transfer of ultrasound energy/momentum into the fluid causes the water to stream and/or move in the direction of the ultrasound field. Combining the cavitation and acoustic streaming, the water molecules are shot into the air (some of which are vaproized by the HIFU) creating a beautiful acoustic fountain.

This work was supported by the National Science Foundation and the National Institutes of Health

References
Lewis et al. Development of a portable high intensity focused ultrasound system. Rev. Sci. Inst. 2008; Lewis et al. Design and characterization of a high-power ultrasound driver with ultra-low output impedance. Rev. Sci. Inst. (In Press) 2009

Reporters and Editors
Reporters can freely use this image. Credit: Cornell University.

Vortex Shedding in the Wake of a Step Cylinder

Chris Morton
Serhiy Yarusevych
Department of Mechanical Engineering
University of Waterloo
Ontario, Canada

14-yarusevych1_2.jpg14-yarusevych2_2.jpg14-yarusevych3_2.jpg

In the sequence of images, water is flowing from left to right over a vertical circular cylinder with a single step change in diameter. The step cylinder is composed of two coaxially joined cylinders of different diameters. Small hydrogen bubbles introduced into the incoming flow are illuminated with a laser sheet to visualize shedding and interaction of spanwise vortices in the cylinder wake, i.e., vortices oriented vertically in the images. Due to the difference in diameters, the vortex shedding frequency in the wake of the small cylinder is higher than that in the large cylinder wake. This results in complex vortex connections between large cylinder and small cylinder vortices that can be seen in the images. Moreover, in addition to wake vortex shedding behind the large and small cylinders, a distinct vortex cell near the step on the large cylinder side presents itself cyclically.

In the first image, vortex shedding parallel to the cylinder axis is observed in the wake of the large cylinder. Over time, vortices in the large cylinder wake become obliquely angled towards the step and eventually a distinct vortex shedding cell can be observed near the step, bordered by the large and small cylinder vortices below and above, respectively (second image). The second image shows a vortex in this middle cell being shed out of phase with two successive large cylinder vortices yet maintaining connections with both of them.

Eventually, the middle cell vortices re align with the large cylinder vortices, such that the former becomes difficult to distinguish via flow visualization (third image). In the third image, oblique vortex shedding at an angle away from the step is observed in the wake of the large cylinder. After a few more vortex cycles, the shedding becomes parallel with the cylinder axis again, marking the beginning of the next middle cell cycle.

This work was supported by NSERC.

References
These images have not been published.

Reporters and Editors
The images can be reproduced only with authors' permission and the reference to authors' names, affiliation, and the corresponding poster presentation. Email Jason Bardi for contact information.

Defining Micro-structured Fluids and Soft Materials, Bottom Up

Lian Leng
Siavash Aslanbeigi
Axel Guenther
University of Toronto

15-leng-thumb.jpgMassively scaled-out microfluidic device for the in-flow formation and perfusion of a 3-D vascularized biomaterial. The device consists of up to ten stacked up silicon elastomer layers forming an array of approximately one hundred microchannels which serve to distribute the working fluids (aqueous alginate and calcium chloride) across the multilayered device. Formation of the biomaterial occurs under a polymerization process where alginate (grey) mixes through diffusion with calcium chloride (orange) at the device exit. The vascularized biomaterial produced can be subsequently perfused through the porous streams previously occupied by calcium chloride. Scale bar 2mm.

This work was funded by NSERC, OGS, Early Researcher Award.

Reporters and Editors
Reporters can freely use this image. Credit: Lian Leng and Axel Guenther, University of Toronto.

Spikes and Bubbles in Turbulent Mixing: High Atwood Number Rayleigh-Taylor Instability

Daniel Livescu (CCS-2/LANL)
Mark R. Petersen (CCS-2/LANL)
Steven L. Martin (Ohio State University)
Patrick S. McCormick (CCS-1/LANL)

livescu-1.gif
The Rayleigh-Taylor instability occurs at the interface between a heavy fluid overlying a light fluid, under a constant acceleration, and is of fundamental importance in a multitude of applications ranging from astrophysics and to ocean and atmosphere dynamics. The flow starts from rest and small perturbations at the interface between the two fluids grow to large sizes, interact nonlinearly, and eventually become turbulent. In many cases, the density ratio between the two fluids is large, e.g. air interpenetrating helium has a density ratio of 7, yet most studies to date address the low density ratio case and no Direct Numerical Simulations (such that all scales of motion are resolved) have been performed for Atwood number, A > 0.5 (corresponding to a density ratio of 3). Previous results at A = 0.5 (Livescu et al, Journal of Turbulence 2009, Livescu and Ristorcelli, Journal of Fluid Mechanics 2007 and 2008, Cabot and Cook, Nature Physics 2006) hint to some startling new physics in high Atwood number Rayleigh-Taylor mixing, for example the asymmetry of the mixing, not seen at small density differences.

livescu-2.gif

The images presented here show the density field obtained from the largest fully resolved instability simulation performed to date: Rayleigh-Taylor instability at A=0.75 (density ratio of 7) on a 2304x4096^2 mesh. The results fully confirm the conjectures made earlier by the authors and are in agreement with previous experiments for the layer growth rate. In particular, the asymmetry of the mixing leads to a tangible alteration of the mixing layer: the formation of "spikes" on the light fluid side and "bubbles" on the heavy fluid side."

Los Alamos National Laboratory is operated by the Los Alamos National Security, LLC for the U.S. Department of Energy NNSA under contract no. DE-AC52-06NA25396. This work was funded in part by the LDRD program at Los Alamos National Laboratory through project number 20090058DR. The simulation was performed on the LLNL ASC Dawn supercomputer, as part of the open science runs.

Reporters and Editors
The images have not been published. Reporters can freely use this image. Credit: Daniel Livescu (CCS-2/LANL), Mark R. Petersen (CCS-2/LANL), Steven L. Martin (Ohio State University), Patrick S. McCormick (CCS-1/LANL)

Please notify Daniel Livescu before using the images.

Miscible Oil Droplets in Alcohol

Roderick R. La Foy, Jesse Belden, Anna M. Shih, Tadd T. Truscott, Alexandra H. Techet
Massachusetts Institute of Technology

In these experiments a droplet of oil approximately 3 millimeters in diameter is released from ~100 mm into a container filled with isopropyl alcohol. Images are captured with an SLR camera by projecting light onto the oil from both the left and right sides. The difference in index of refraction between the oil and alcohol cause the edges of the oil droplet to appear bright. The oil is soluble in and denser than isopropyl alcohol, which results in the drop naturally falling through the alcohol and eventually fully dissolving.

18-belden1.jpg

The drop of oil impacts the alcohol surface with an initial velocity, and inertial, viscous and diffusive forces combine to form the droplet into an upside-down “wine glass” shape (first image).

18-belden2.jpg

As the oil descends, the droplet expands radially forming a concave shape, causing the droplet to become thinner (second image). The denser core continues to descend, vertically elongating the droplet. This forms the droplet into a thinning hyperboloid sheet, which ultimately fragments due to an instability (not shown) [1].

References
[1] S. Residori, P. K. Buah-Bassuah, and F. T. Arecchi. 2007 Fragmentation instabilities of a drop as it falls in a miscible fluid, Eur. Phys. J. Special Topics, v. 146, pp. 357-374.

Reporters and Editors
These images have not been published, but may be used freely. Credit: R. R. La Foy, J. Belden, A. M. Shih, T. T. Truscott, & A. H. Techet.

Water Drops in Hot Oil

Enrique Soto
Andrew Belmonte
The G.W. Pritchard Labs
Penn State University

Roberto Zenit
Instituto de Investigaciones en Materiales
Universidad Nacional Autónoma de México

Have you ever wondered what happens when a drop of water falls in hot oil? We did and we made an experiment!

A high-speed video at 3000 frames per second was recorded. Drops of water at room temperature were released in hot oil, which had a temperature higher than that of the boiling point of water. Once the drop reaches the bottom of the container, it sticks to the surface with a certain contact angle. Then, part of the drop vaporizes. The vapor expands inside the drop and deforms its interface. The way in which the vapor expands, either smooth or violent, depends on the location of the nucleation point and oil temperature. The surface roughness is generated by vapor bubble contraction and expansion. This mechanism makes the noise and the explosion splashes the oil everywhere.

This work was funded by Conacyt, DGAPA, NSF.

References
Brennen, C.E . Fission of collapsing cavitation bubbles, J Fluid Mech, 472, 153-166 (2002)

Reporters and Editors
Reporters may freely use these images. Credit: The G.W. Pritchard Labs, Penn State University

Interfacial Jets: An Oscillating Bubble Collapses Near a Fluid-Fluid Interface

Silvestre Roberto Gonzalez Avila, Soon Yew Lim,
Nanyang Technological University, Singapore

Jedd Betari,
École Polytechnique, France

Siew-Wan Ohl, Evert Klaseboer,
Institute of High Performance Computing, Singapore

Boo Cheong Khoo
Department of Mechanical Engineering,
National University of Singapore

20-ohl-thumb.jpgA fluid-fluid interface between two immiscible liquids of different densities is formed, here on top water and below a denser liquid (hydrofluoroether, also known as HFE). HFE is 1.5 times denser than water yet both liquids have very similar viscosity. An explosively expanding bubble with a maximum bubble radius of 0.68 mm is generated by vaporizing the water just above the fluid-fluid interface with a short laser pulse. The first growth-shrink cycle of the bubble lasts only 40 microseconds. During the shrinkage or so-called collapse of the bubble, a jet is formed and accelerated from the top of the bubble towards the heavier liquid HFE. This phenomenon is analogous to that of an oscillating bubble collapsing near rigid boundaries, where jetting is always observed towards the surface. Interestingly the liquid-liquid interface with a density ratio of 1.5 acts very similar and induces the bubble to collapse with a jet towards it.

After the collapse of the bubble, the remnants of the bubble (pockets of gas) are injected into HFE liquid. Seemingly in response, the HFE develops a jet that shoots back into the water above it. As the result of surface instabilities the jet develops a 'crown' like structure on its top. Eventually the top 'crown' part of the jet breaks off into a separate droplet which later returns back into the HFE due to gravity. Thus in the end, the initial clean fluid-fluid interface is restored.

This work is funded by the Ministry of Education Singapore (T208A1238), and Ecole Polytechnique, France

References
  1. Lord Rayleigh 1917, Philos. Mag. 34, 94-98.
  2. Lauteborn W. & Bolle H. 1975, J. Fluid. Mech. 72, 391-399.
  3. Klaseboer E., Khoo B.C. & Hung K.C. 2005, J. Fluids Struct. 21, 395-412.
  4. Robinson P.B., Blake J.R., Kodama T., Shima A. & Tomita Y. 2001, J. Appl. Phys. 89, 8225-8237.
  5. Chahine G.L. 1977, J. Fluids Engng., Trans. ASME 99, 709-716.
  6. Turangan C.K., Ong G.P., Klaseboer E. & Khoo, B.C. 2006, J. Appl. Phys. 100, 054910.
  7. Klaseboer E. & Khoo, B.C. 2004, J. Appl. Phys. 96, 5808-5818.

Reporters and Editors
Reporters may freely use this image. Credit: Cavitation Lab, School of Physical and Mathematical Sciences (SPMS), Nanyang Technological University.

Vortical Structure of Plane Jet Issuing from a Sinusoidal Wavy Nozzle

Sang Joon Lee
Hak Lim Kim
S. Rajagopalan
Pohang University of Science and Technology

These images show the flow structure of the plane jet issuing from a sinusoidal wavy nozzle (utmost left side of each image) in three horizontal planes at z = 0, 10, 15mm. The upper three images exhibit the propagation of vortices from the wave edge (z=15mm) to the jet center plane (z=0mm) of the in-phase sinusoidal nozzle in which the upper and lower sides of the sinusoidal nozzle have the same wavy shape without phase difference. The lower images show the large-scale vortices of the jet from the 180° out-of-phase sinusoidal nozzle.

Peculiar vortex structure is formed due to interaction and central migration of large-scale vortices shed from the sinusoidal edge of the nozzle as the flow goes downstream. Compared to the in-phase sinusoidal nozzle jet, the 180° out-of-phase nozzle jet exhibits extension of potential core region and effective suppression of turbulent mixing.

lee-kim09-1.jpg

lee-kim09-2.gif

This work was financially supported by KOSEF (Korea Science and Engineering Foundation.

The image has not been published.

Virtual Pressroom Archive

Virtual press rooms feature stories and images related to the Division's annual meetings and other news related to fluid dynamics.

APS DFD Annual Meeting Archives

2016 | 2015 | 2014 | 2013 | 2012 | 2011 | 2010 | 2009 | 2008

Image & Video Galleries

Every year, the APS Division of Fluid Dynamics hosts posters and videos that show stunning images, graphics and videos from either computational or experimental studies of flow phenomena. The most outstanding entries were selected by a panel of referees for artistic content and honored for their originality and ability to convey information.

The 62nd Annual Meeting Image Gallery highlighted a subset of submitted images and videos prior to the judging process.